DevTools, short for Browser Developer Tools, are essential for web developers. They come built-in with browsers like Chrome, Firefox, and Safari, offering features to easily inspect, debug, and optimize web applications.
This guide covers basics to advanced techniques in HTML/CSS, JavaScript, performance optimization, mobile-friendliness, and security audits.
Quick Links
Overview of Major Browsers and Their DevTools
While the core functionalities are similar, each browser comes with its own set of Developer Tools.
Here are quick instructions on how to access them in three popular browsers:
- Google Chrome: Right-click on an element, select “Inspect,” or use
Ctrl + Shift + I(Windows/Linux) orCmd + Opt + I(Mac). - Mozilla Firefox: Similar to Chrome, right-click on an element and choose “Inspect,” or use
Ctrl + Shift + I(Windows/Linux) orCmd + Opt + I(Mac). - Microsoft Edge: Just like Firefox, right-click on an element and choose “Inspect,” or use
Ctrl + Shift + I(Windows/Linux) orCmd + Opt + I(Mac). - Apple Safari: Enable Developer Tools in the Advanced preferences, then right-click and select “Inspect Element” or use
Cmd + Opt + I.
Inspecting and Debugging HTML/CSS
The Elements panel is your go-to tool for inspecting and modifying HTML. It’s like having x-ray vision for web pages.
To access it, open Developer Tools and navigate to the “Elements” tab.

Once there, hover over any element on the page, and you’ll see it highlighted in the panel.
Need to tweak a style or understand the structure?
Simply right-click on an element and select “Inspect” to dive into the details.
<div class="example-container">
  <p>This is an example paragraph.</p>
</div>
Here, the class “example-container” is highlighted in the Elements panel, allowing you to inspect and modify it on the fly.
Styling with the Styles Panel
The Styles panel is where the magic happens. Here, you can view and modify CSS styles in real time.
Want to experiment with different colors, fonts, or margins?
Simply click and type to see instant updates.
.example-container {
  background-color: #f0f0f0;
  padding: 10px;
  border: 1px solid #ccc;
}
In this example, changing the background color in the Styles panel instantly updates the appearance of the “example-container.”
Debugging CSS Issues
CSS issues can be tricky, but fear not! Developer Tools are here to help. The “Console” tab will be your companion in identifying and fixing CSS problems.
If a style isn’t being applied as expected, check the console for error messages or warnings.
.example-container {
  width: 100%;
  margin: 20px;
  /* Typo in the property name */
  paddng: 10px;
}
A typo like “paddng” triggers a console warning, pointing you to the issue. Polish your HTML and CSS skills using the Elements and Styles panels.
JavaScript Debugging Techniques
Moving to JavaScript, the “Console” tab is your command center. It lets you run commands, log messages, and crucially, debug your code.
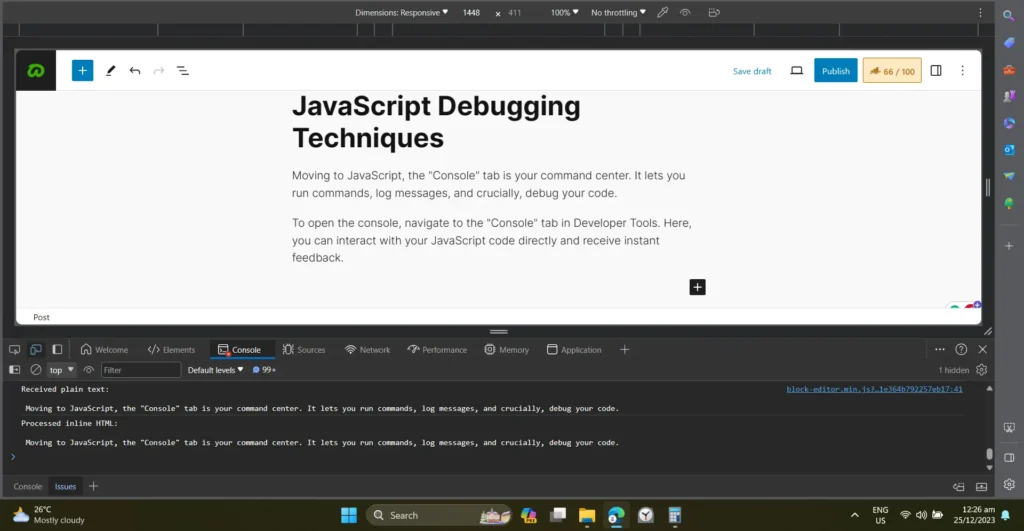
To open the console, navigate to the “Console” tab in Developer Tools. Here, you can interact with your JavaScript code directly and receive instant feedback.
// Logging a message to the console
console.log("Hello, aspiring developers!");

// Performing calculations
let x = 5;
let y = 10;
console.log("Sum:", x + y);
The console is your friendly companion for quick experiments and immediate insights into your JavaScript code.
Setting Breakpoints and Stepping Through Code
When facing complex issues, setting breakpoints and stepping through code is invaluable.
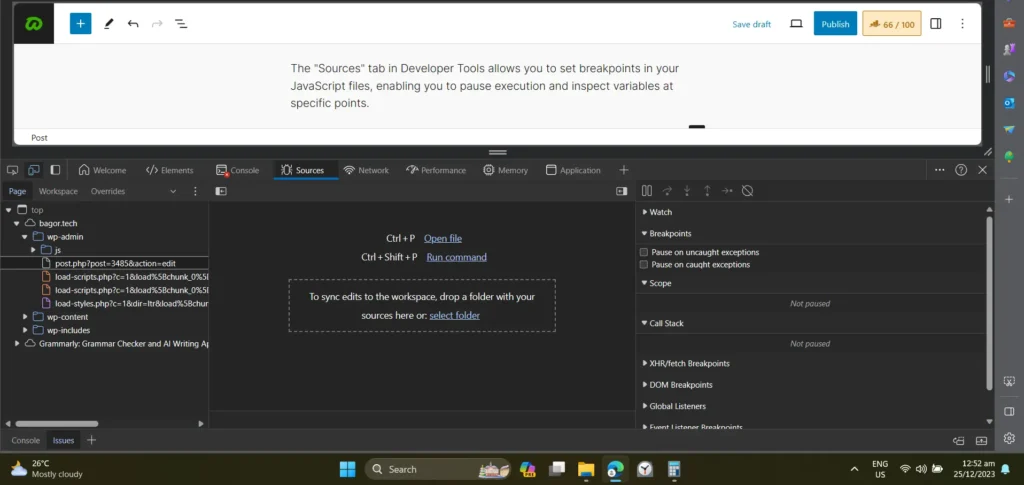
The “Sources” tab in Developer Tools allows you to set breakpoints in your JavaScript files, enabling you to pause execution and inspect variables at specific points.
// JavaScript function with a breakpoint
function multiply(x, y) {
  let result = x * y; // Set a breakpoint here
  return result;
}

// Calling the function
let product = multiply(3, 4);
console.log("Product:", product);
By setting a breakpoint inside the “multiply” function and running the code, you can step through each line, understanding how variables change and identifying potential issues.
Utilizing the Network Panel for Monitoring JavaScript Requests
The “Network” panel is not just for monitoring network activity; it’s a powerful tool for understanding how your JavaScript interacts with the server. Here, you can inspect requests, responses, and timings.
// Making a simple AJAX request
fetch("https://api.example.com/data")
  .then(response => response.json())
  .then(data => console.log("Fetched data:", data))
  .catch(error => console.error("Error fetching data:", error));
Use the “Network” panel to trace the lifecycle of network requests and ensure seamless communication between your frontend and backend.
Advanced Debugging Features and Tips
Beyond the basics, Developer Tools offer advanced features like conditional breakpoints, watch expressions, and async debugging.
These tools come in handy when dealing with intricate JavaScript scenarios.
// Conditional breakpoint example
for (let i = 0; i < 10; i++) {
  if (i === 5) {
    debugger; // Pause only when i is 5
  }
  console.log(i);
}
Use these advanced features to boost your JavaScript debugging skills and conquer tricky bugs.
Network Analysis for Performance Optimization
Efficient web applications rely on optimal network performance. The “Network” panel in Developer Tools is your gateway to understanding and optimizing the communication between your browser and the server.
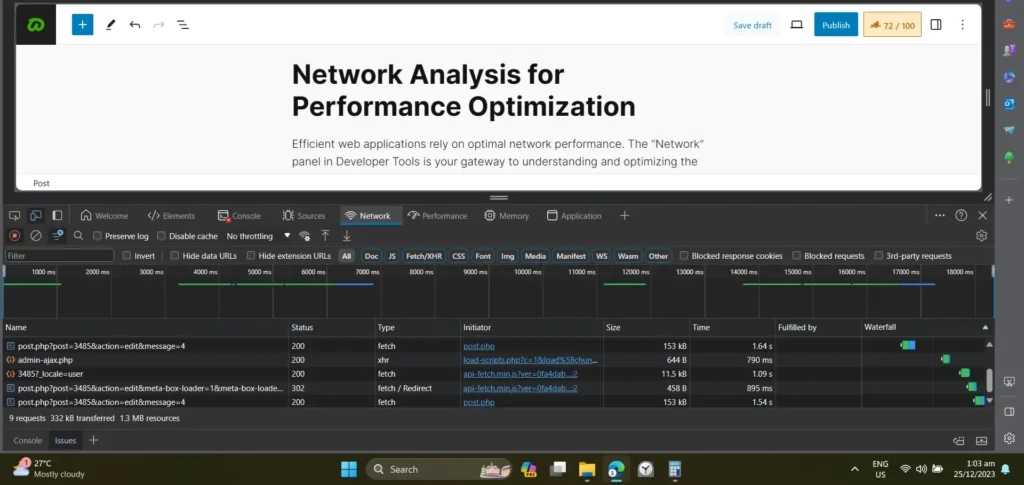
Upon opening the “Network” tab, you’ll witness a waterfall of network requests triggered by your webpage.
Each bar represents a request, detailing information such as the request method, status, and timing.
<!-- Example image request -->
<img src="https://example.com/image.jpg" alt="Example Image">
By inspecting network requests, you gain insights into load times, resource sizes, and potential bottlenecks. Identify opportunities for optimization and ensure a swift user experience.
Identifying and Resolving Performance Bottlenecks
Performance bottlenecks can manifest in various forms, from large image files to inefficient JavaScript code.
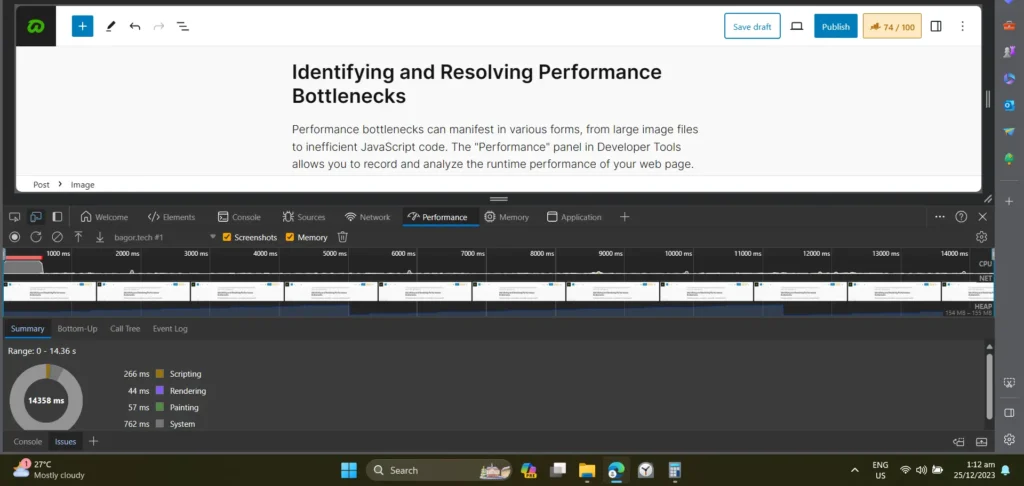
The “Performance” panel in Developer Tools allows you to record and analyze the runtime performance of your web page.
Initiate a performance recording, interact with your webpage, and stop recording to view a detailed timeline.
Look for areas of concern, such as long-running JavaScript tasks or excessive rendering times.
// Example of inefficient code causing performance issues
function calculateFibonacci(n) {
  if (n <= 1) {
    return n;
  } else {
    return calculateFibonacci(n - 1) + calculateFibonacci(n - 2);
  }
}

// Triggering the function with a high value
calculateFibonacci(40);
In this example, the “Performance” panel can help identify the performance hit caused by the inefficient “calculateFibonacci” function.
Leveraging the Performance Panel for Detailed Insights
The “Performance” panel provides a holistic view of your web page’s performance, highlighting key events such as loading, scripting, rendering, and painting. Dive into the details, identify areas of improvement, and fine-tune your code for optimal user experience.
Mobile Development and Responsive Design
As smartphones and tablets become more common, it’s vital to make sure your web apps work well on different devices.
The “Device Mode” in Developer Tools lets you simulate different mobile devices, giving you a firsthand look at how your webpage responds.
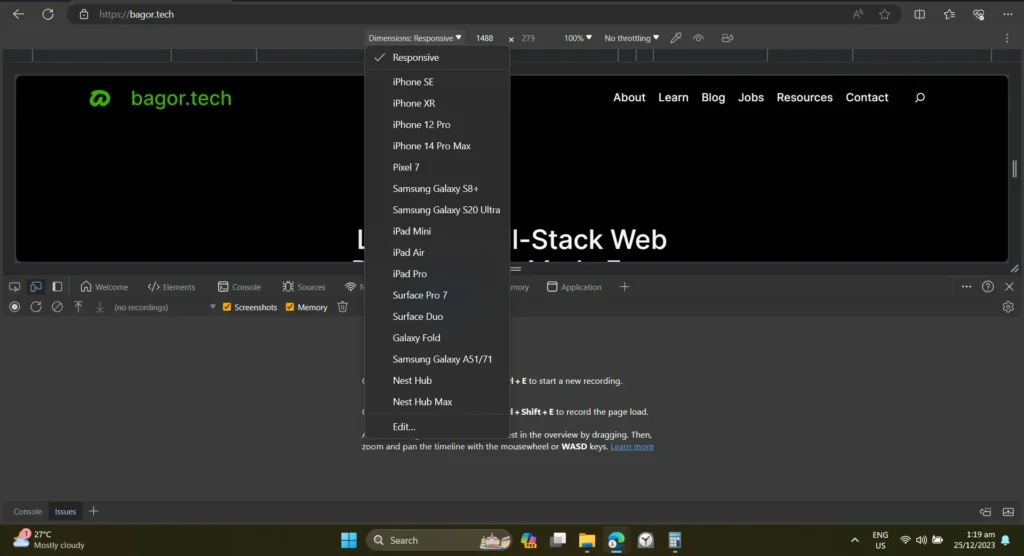
Open Developer Tools, click on the “Toggle Device Toolbar” icon, and select a device from the dropdown menu.
Adjust the viewport size and emulate network conditions to simulate real-world scenarios.
<!-- Example viewport meta tag for responsive design -->
<meta name="viewport" content="width=device-width, initial-scale=1">
Include the viewport meta tag in your HTML to optimize your web page for a variety of screen sizes.
Testing and Debugging Responsive Design with Developer Tools
The “Elements” and “Styles” panels become even more valuable when working on responsive design.
Toggle device mode, inspect elements, and apply styles to ensure a seamless experience across different screen sizes.
/* Example responsive CSS for a navigation menu */
@media screen and (max-width: 600px) {
  .nav-links {
    display: none; /* Hide navigation links on small screens */
  }

  .menu-icon {
    display: block; /* Display a menu icon instead */
  }
}
Here, a media query is used to adapt the navigation menu based on the screen width, optimizing the layout for smaller screens.
Addressing Common Challenges in Mobile Development
Mobile development comes with its unique set of challenges. From touch interactions to varying screen sizes, it’s essential to address these challenges for a seamless user experience.
Developer Tools equip you with the capabilities to identify and resolve issues specific to mobile devices.
Security Auditing and Best Practices in Browser Developer Tools
Security is paramount in web development. The “Security” panel in Developer Tools serves as your virtual security guard, helping you identify and address potential vulnerabilities in your web applications.
Navigate to the “Security” tab, load your webpage, and observe the security status.
Issues such as insecure connections or mixed content warnings will be flagged, allowing you to take prompt action.
<!-- Example of mixed content warning -->
<script src="http://insecure-script.com"></script>
Here, loading an insecure script triggers a mixed content warning in the “Security” panel.
Best Practices for Securing Web Applications
Preventive measures play a crucial role in securing your web applications. Adhere to best practices such as using HTTPS, validating user input, and implementing proper authentication mechanisms.
// Example of input validation in JavaScript
function validateEmail(email) {
  const regex = /^[^\s@]+@[^\s@]+\.[^\s@]+$/;
  return regex.test(email);
}
In this example, the validateEmail function ensures that the provided email follows a valid format, enhancing security by preventing potential injection attacks.
Implementing HTTPS and Mitigating Security Risks
The adoption of HTTPS is non-negotiable for secure web communication. Obtain an SSL certificate, configure your server, and ensure all connections are encrypted. Developer Tools will indicate a secure connection with a reassuring padlock icon.
Additionally, stay vigilant against common security risks such as cross-site scripting (XSS) and cross-site request forgery (CSRF). Regularly audit your code and leverage Developer Tools to identify and rectify potential vulnerabilities.
Advanced Tips and Tricks
Keyboard Shortcuts and Time-Saving Techniques
Efficiency is the key to productivity. Developer Tools offer a range of keyboard shortcuts and time-saving techniques to expedite your workflow.
Here are a few essential shortcuts:
- Ctrl + Shift + I (Windows/Linux) or Cmd + Opt + I (Mac): Open Developer Tools.
- Ctrl + Shift + J (Windows/Linux) or Cmd + Opt + J (Mac): Open the Console tab directly.
- Ctrl + Shift + C (Windows/Linux) or Cmd + Opt + C (Mac): Inspect an element on the page.
Explore these shortcuts and discover others that align with your development preferences. Mastering these keyboard commands will make your interaction with Developer Tools seamless.
Customizing Developer Tools for Efficiency
Tailor Developer Tools to suit your unique needs. Click on the gear icon in the top-right corner of Developer Tools and explore the settings.
Adjust the theme, customize panel layouts, and enable or disable features based on your workflow.
For example, experiment with different themes to find one that reduces eye strain during long coding sessions. Customizing the layout allows you to prioritize panels based on your primary tasks.
Integrating Developer Tools with Other Development Tools and Frameworks
Developer Tools seamlessly integrate with various development tools and frameworks. Leverage this interoperability to enhance your capabilities. For instance:
- React DevTools: Integrate with the React library for advanced debugging and state inspection.
- Lighthouse: Use Lighthouse for automated audits and performance metrics directly within Developer Tools.
Explore the extensions and integrations available for your specific tech stack, and enhance your development workflow by combining the power of Developer Tools with other tools.
Conclusion
Keep going on your full-stack web development journey by diving into Browser Developer Tools. Explore hands-on in your projects, confident in your ability to inspect, debug, and optimize.
Your dedication to mastering these tools not only boosts your skills but also enhances web experiences globally. Remember, mastery is an ongoing process.
Stay curious, stay persistent, and keep pushing your boundaries with Browser Developer Tools.
Best of luck in your full-stack web development adventures.
Happy coding!
Leave a Reply